
This year I’ve blogged about a lot of local elections here in West St. Paul:
- Mayor: David Meisinger vs. Jenny Halverson
- City Council Ward 1: Pat Armon vs. Bob Pace
- City Council Ward 2: Anthony Fernandez vs. John Justen
- City Council Ward 3: Dave Napier vs. John Ramsey
Why?
Part of my frustration goes back to the misleading statements and misinformation in the 2014 election. But alas, I’ve been complaining about how hard it is to find information about local races since 2003.
Seriously, the most we get are candidate sites and a few candidate forums and questionnaires. Those are helpful, but there’s no push back. A candidate can say whatever they want and it goes unchallenged. It’s no wonder turnout for local elections is horrendous.
So I guess it’s time to start fixing the problem. I did push back when candidates were leaving out important details or being completely misleading. I also spoke up when they were being misrepresented. I’ve been passionate and certainly biased, but hopefully I wasn’t too much of a jerk.
After all, whether I agree or disagree with these candidates, they’re all doing a public service. It’s becoming harder to find candidates to run. While it wasn’t an issue this cycle, here in West St. Paul two city council members ran unopposed in 2014 and the mayor ran unopposed in 2012. These folks are stepping up, and my hat goes off to them. I realize it’s a lot easier to write blog posts about city government than to actually run city government.
In the process of writing these posts I’ve been able to talk to a lot of the candidates. It really humanizes the debate when you have to talk to someone face to face. I think the more we can do that the better. If you’ve got questions, talk to your candidate or elected official. They’re regular people and most are happy to talk to you.
Taxes vs. Investment
In many of the above races I say that it comes down to an issue of investment vs. low taxes. One group believes in the long-term benefits of investment, that investing in infrastructure will raise property values and bring more business and residents to the city. The other group argues that those investments are costing too much, rising property taxes will drive people away, and lower taxes are the only way to draw business and residents.
So a fair question to ask is where are our taxes at and where are they going to go?
Unfortunately, it’s not a simple question. It turns out property taxes are insanely complex. I’ve got a short answer and a long answer.
The Short Version:
- For 2016 and a house valued at $200,000, our city property taxes our the third highest out of 60 metro area cities with populations of 10,000 or higher. Our total property taxes (including county, school district and extras) are 34th out of 60. (Note: Comparing property taxes is notoriously tricky. I think the total property tax is a more fair comparison, but I’ll give both numbers and let you decide. See below for more details & pretty graphs.)
- For 2017 and an “average” house valued at $185,000, city property taxes could go up as much as $80 (these aren’t final numbers, they could come down, but they won’t be any higher).
- That’s about a 6.7% increase, or $6.67 per month. We’re likely to see a similar increase in 2018.
So property taxes are going up. However, I think a 6.7% increase is pretty modest considering we’re wrapping up the biggest public works project in city history and we’ve yet to get the help we expected from the state.
That’s where the numbers are at. You can decide if that’s smart investing on our infrastructure that will pay off in the long term, or if that’s wasteful spending and we need to lower property taxes at all costs.
The Long Version:
OK, let’s dive into the details.
Metro Area Comparison
So I’ve heard a lot of people talk about how West St. Paul has low property taxes. I noticed that when I moved here in 2007 from St. Paul. But how low are they, comparatively?
Well, it’s complicated. First of all, comparing city property taxes is like comparing apples and oranges. Are the cities the same size? Do they receive the same level of local government aid from the state? Do they have similar property values? Are they both first-ring suburbs? Are they in the same county? The same school district? No matter where you look, the answer to many of these questions is no, so it’s hard to do a straight comparison.
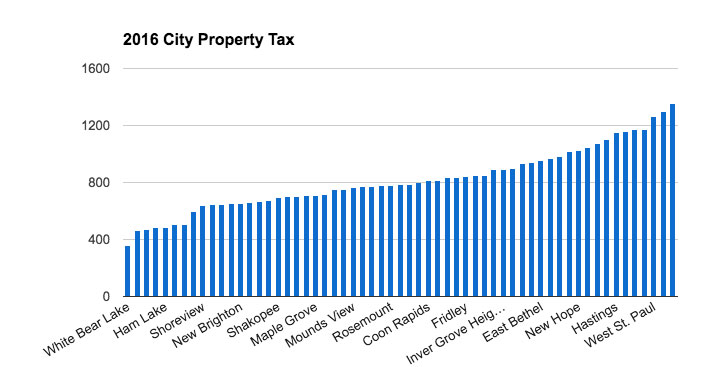
The League of Minnesota Cities offers property tax data, including a calculator, so I looked at 2016 property taxes for a house valued at $200,000 in metro area cities of 10,000 people or more.
If you look at just city tax data, West St. Paul is definitely on the high end (third from the highest out of 60) with $1,262:
However, our county, school district and other extra taxes are lower, so for total property tax we end up in the middle (34th out of 60) with $2,647:
Again, keep in mind that it’s hard to compare. Third highest sounds pretty bad, but we’re also a first-ring suburb in smaller county and a more affordable school district. I would guess West St. Paul has more expenses from being a first-ring suburb, and Dakota county doesn’t pick it up like they might in Ramsey or Hennepin counties. But that’s more of a guess (feel free to chime in if you’re well versed in this stuff.)
Another reason our city property taxes may seem higher is that we don’t get as much local government aid (LGA) from the state. South St. Paul, for example, gets twice as much ($2,404,574 vs. $1,247,977 for 2017). We weaned ourselves off LGA starting in 2010 after the state stiffed us one too many times. Now we restrict LGA money to capital expenses and do not use it for the operating budget, thus we have higher taxes to cover the operating budget.
Another factor is property values. Our values still haven’t returned to their 2008, pre-crash levels.
Historic Tax Levels in West St. Paul
So what if we don’t compare with other cities, and just look at our own data? That’s complicated too.
Here’s a look at our property tax rate for the last five years and next year:
- 2012: 62.21%
- 2013: 69.45%
- 2014: 70.87%
- 2015: 70.76%
- 2016: 69.95%
- 2017: 73.28% (maximum estimate, based on preliminary levy)
Note that the 2017 numbers are not final. The city had to give a preliminary levy by Sept. 30, where we estimate and say what our maximum levy will be. Then as we finalize numbers we can hopefully bring that number down. I have no idea how much it will come down (I’ve asked, nobody knows—too many variables), but that’s the highest it could possibly be.
What do those numbers mean? Well, for an “average” home it varies, based on average home value and the current rate. So an average West St. Paul home was valued at $152,000 in 2012, and the city property tax was $945. In 2017, an average home is valued at $185,000 and the city property tax bill is $1,203.
Here’s what the “average” city property tax impact (increase or decrease) looks like over the last five years and next year:
- 2012: -$95
- 2013: -$14
- 2014: +$16
- 2015: +$91
- 2016: +$85
- 2017: +$80 (maximum estimate, based on preliminary levy)
Again, that 2017 number is a preliminary maximum estimate. It could end up being lower than that, but it won’t be any higher. And remember what “average” means. If you look at your property tax bill over the last five years you might not see a similar trend. It all depends. Notice that the property tax rate went down slightly from 2014 to 2015, but impact actually went up. (See? Freakin’ complicated.)
In general, our property taxes have been going up by about $85 per year and we can expect a similar hike in 2017. And it’s early to look at 2018, but more than likely we’ll see a similar hike then.
So what does all this mean? (Anybody still with me?)
I think there are two additional bits of context that put this into perspective for me:
1. What’s the Relative Increase?
Remember to keep these increases in context. If you’re going to pay $1,203 city property tax in 2017 and it went up $80 (again, the highest it could possibly go up), that’s a 6.7% increase (and inflation is likely to be 2.4% next year). We’re talking about an additional $6.67 a month.
That’s not nothing. It can have serious impacts on people. But I don’t think the sky is falling. I don’t think that’s runaway spending.
(Keep in mind that 6.7% raise is your city property tax only. The percent increase for your total property tax bill would be even smaller.)
2. Infrastructure
Many of these increases are due to infrastructure projects. A lot of those were put off in the last few years due to the economic collapse. Street repairs were put on hold and equipment purchases were put off as our city government tightened the belt to weather the storm. Municipalities across the country did the same thing. And now we’re playing catch up (and guess what, the near completion of Robert Street doesn’t mean we’re done—we’ve got more street repairs coming).
We can’t exactly let our roads fall apart. This is investing in our community for the long-term, and it can pay dividends
Conclusion
So as we weigh property taxes vs. infrastructure needs, I think it’s a worthwhile investment to pay maybe $80 more next year and maybe another $80 more the year after that. (Based on the suspension repairs I’ve needed from driving on the old Robert Street, that sounds like a bargain.)
If you think low property taxes are the only thing that matters, then maybe $80 sounds like way too much for you. If that’s the case, I wonder how you’re going to address our crumbling roads. And remember that Robert Street wasn’t just a simple repave. Many of the changes were trying to curb the street’s reputation as one of the worst roads in the state for accidents.
Maybe low property taxes (and high accidents?) will bring in more businesses and residents, which will increase how much the city brings in with property taxes, and then we can address infrastructure. But I can’t see that working. When I bought my house the property taxes amounted to less than 1% of the purchase price. I looked at the number, but it was pretty low on the list of what convinced me to move here.
I think the kind of improvements we’ve seen on Robert Street and at Harmon Park are much more likely to influence someone to move to West St. Paul than property taxes that are slightly lower than other cities.
Also, at this point we’re committed to higher property taxes. Even if low tax advocates win the election, we still have projects to pay for and infrastructure to rebuild. It’s unlikely anyone could deliver lower property taxes without making major cuts or neglecting our streets.
I’ve said this before, and I’ll say it again: I think West St. Paul needs to make smart investments to improve our city. Those investments will attract developers and residents. We can’t nickel and dime our way to low property taxes and then expect those slightly lower numbers to bring in enough people to make a difference.
Taxes are going up, but not astronomically. And our infrastructure is getting way better. I think that’s a win.
Those kind of smart investments require planning, vision and leadership. That’s what I see in the campaigns of Jenny Halverson for mayor, Pat Armon for city council ward 1, John Justen for city council ward 2 and Dave Napier for city council ward 3.
Remember to vote next week.
Disclaimer: The information shared in this post came from the League of Minnesota Cities and West St. Paul Finance Director Joan Carlson, who was nice enough to answer my questions and walk me through the complications of property taxes. Any errors in the data are mine as are any conclusions based on the data, and neither should reflect on the sources.
And if anyone wants to see the data I pulled from the League of Minnesota Cities (again, for 2016 based on $200,000 home value), have at it.
Update: (Jan. 10, 2017)
Those final budget numbers did come in lower. We’ll see an average hike of $50 in 2017 instead of $80:
Carlson said the average home value in 2017 will be $185,000. This puts estimated city property tax for the average home at $1,180, approximately a $50 increase from 2016.